Tuesday, October 16, 2012

Basic Pig usage to process Argus data

Some quick notes on testing out Pig in local mode to process some basic Argus data.

Argus
  • Capture a sampling of network traffic with Argus
    • argus -w capture.arg -i eth0
  • Pre-process the Argus data
    • ra -r capture.arg -nn -c, -s proto saddr sport daddr dport bytes - tcp or udp > capture.csv
Install Hadoop and Pig
  • cd /usr/local
  • tar -xvzf hadoop-0.20.2.tar.gz 
  • ln -s /usr/local/hadoop-0.20.2 /usr/local/hadoop
  • tar -xvzf pig-0.10.0.tar.gz 
  • ln -s /usr/local/pig-0.10.0 /usr/local/pig
  • Add to your .bash_profile
    • export JAVA_HOME=/usr
    • export PATH=$PATH:/usr/local/hadoop/bin:/usr/local/pig/bin
Run your Pig scripts like
  • pig -x local <blah>.pig
Sample Pig configs

sum_dport.pig


argfile = load 'capture.csv' using PigStorage(',') as (Proto,SrcAddr,Sport,DstAddr,Dport,TotBytes);
grouped = group argfile by Dport;
mysum   = foreach grouped generate group, SUM(argfile.TotBytes);
store mysum into 'arg_pig_out';

sum_dport_by_saddr.pig

argfile = load 'capture.csv' using PigStorage(',') as (Proto,SrcAddr,Sport,DstAddr,Dport,TotBytes:int);
grouped = group argfile by (SrcAddr,Dport);
mysum   = foreach grouped generate group, SUM(argfile.TotBytes);
bysum   = order mysum by $1 desc;
top10   = limit bysum 10;
dump top10;

sum_dport_by_saddr_filter22.pig

argfile = load 'capture.csv' using PigStorage(',') as (Proto,SrcAddr,Sport,DstAddr,Dport:chararray,TotBytes:int);
onlyssh = filter argfile by Dport matches '22';
grouped = group onlyssh by (SrcAddr,Dport);
mysum   = foreach grouped generate group, SUM(onlyssh.TotBytes);
bysum   = order mysum by $1 desc;
top10   = limit bysum 10;
dump top10;

unique_srcip_dstip_dstport.pig

argfile = load 'capture.csv' using PigStorage(',') as (Proto,SrcAddr);
grouped = group argfile by SrcAddr;
uniq    = distinct grouped;
top10   = limit uniq 10;
dump top10;

Tuesday, January 10, 2012

brain dump #1

for i in $(cat /usr/local/hadoop/conf/slaves); do scp mapred-site.xml $i:/usr/local/hadoop/conf/mapred-site.xml; done

if (grep -q "^/usr/local/lib$" /etc/ld.so.conf); then echo ""; else echo "/usr/local/lib" >> /etc/ld.so.conf; fi

lftp :~> set ftp:ssl-force true
lftp :~> set ftp:ssl-protect-data true
lftp :~> set ssl:verify-certificate true
lftp :~> connect ftp.domain.tld
lftp ftp.domain.tld:~> login my_username

test ssl anonymous auth:
openssl s_client -starttls smtp -crlf -connect some_mail_server:25 -cipher aNULL

test ssl on smtp:
openssl s_client -starttls smtp -crlf -connect some_mail_server:25

low cipher checks:
openssl s_client -connect some_web_server:443 -cipher LOW:EXP

shadow hash:
openssl passwd -1 -salt XXYYZZ11

screen rsync -avz /source/dir/ /target/dir/

rsync -avz -e ssh /source/dir/ user@target_system:/target/dir/

rsync -avz --delete /source/dir/ /target/dir/

rsync -avz --exclude=.snapshot /source/dir/ /target/dir/

linux performance troubleshooting notes


vmstat <# in seconds>
procs
r = # of processes waiting for cpu
b = # of processes waiting for i/o
swap
si and so = swap in and swap out;
close to 0;
no more than 10 blocks/sec
io
bi and bo = disk i/o
system
in = # of interrupts / sec
cs = # of context switches / sec
cpu
us = % user
sy = % system
id = % idle
wa = % i/o wait


iostat -dx <# in seconds>
various rw/sec options
await = # of milliseconds required to
respond to requests
%util = device utilization


top
load = 1m 5m 15m
(average # processes waiting on cpu time)
(quad core load of 4 is really same
amount as 1 core load of 1)
cpu = us/user sy/system id/idle wa/io_wait
avail ram = free mem + cached

'C' = sort processes by %CPU
'M' = sort processes by %MEM


* high vmstat us cpu shows cpu-bound combined with
procs piled up in procs r column, combined with
low disk util in iostat
* high vmstat procs b column combined with high disk
util in iostat show i/o bound
* high values in swap si & so in vmstat show swapping
* idle machines show low r/b in vmstat procs,
high % in cpu id
* iostat to track down which device is getting
heavy reads/writes

Friday, November 9, 2007

Syslog-NG Performance Tuning


I figured I would post some general tuning options that really improve performance on busy central syslog-ng servers. The following settings are used in 2.x, although most will work in some earlier versions as well. These settings work well for me in a tiered environment where client servers are sending both over tcp and udp, from standard syslog and syslog-ng, to a central server(s) running syslog-ng 2.0.5. They are both used in heavy usage (25+ GB / day) situations, and in environments with plenty of hosts (900+).

On to the configuration choices for your central log servers...

Name Resolution

You most likely will want to resolve the IP addresses of client hosts to their hostnames, so enabling name lookups via use_dns(yes) is probably turned on. However, you should ensure you are using your cache properly. Adding dns_cache(1500) and dns_cache_expire(86400), both allow a cache of 1500 entries and set the expiration of entries in the cache to 24 hours. Keep in mind, to allow for enough entries, and account for how often your hosts change IP addresses - such as in dynamic dns environments, etc. These numbers here are just given as an example, tailor to your situation.

If you would rather use the hosts file instead, look into use_dns(persist_only) and dns_cache_hosts(/etc/hosts).

Message Size

Not so much a performance tuning option, but one that needs addressing anyhow. If you are only collecting system logs, the default setting of 8192 bytes is probably enough - but if you collect application logs, you will need to plan accordingly with your log_msg_size(#) option. You will see in your logs, indications of messages being split because they are too long if you have messages going beyond this length.

Output Buffers

Here is an extremely important setting - log_fifo_size(#). The log_fifo_size(#) setting sizes the output buffer, which every destination has. The output buffer must be large enough to store the incoming messages of every source. This setting can be set globally or per destination.

For the log_fifo_size(#), the number indicated is the number of lines/entries/messages that it can hold. By default, it is globally set, extremely conservatively - and if you do any amount of traffic, you will end up seeing dropped messages at some point. The statistics that include dropped messages are printed to syslog every 10 minutes unless you have altered this. In the statistics line it will let you know which destination is dropping messages and how many. You can then make determinations there of whether to globally increase it or per destination, and also an idea of how much larger you need to make it.

Flushing Buffers with sync

From the syslog-ng documentation: "The syslog-ng application buffers the log messages to be sent in an output queue. The sync() parameter specifies the number of messages held in this buffer."

By default, sync(#) is set to 0, which flushes messages immediately - which depending on your logging volume, can be fairly taxing. Increasing this number gently, say to 10 or 20, will hold that number of messages in its buffer before they are written to their destination.

Other Important Considerations

If you are still having trouble with dropped messages, look into using flow control within syslog-ng. Flow control allows you to finely tune the amount of messages received from a source. Although, there are potential other issues you must account for, such as slowing down the source application if it cannot hand off its log messages, etc.

Users with traditional syslog clients sending their logs via UDP, should have a look at this page on UDP Buffer Sizing.

Also, sync() and log_fifo_size() should be tweaked on your client servers as necessary if they are using syslog-ng, and handle heavy loads, sporadic sources, etc. Remember to use your statistics log entries to help you identify problems and load effectively.

Thursday, November 1, 2007

Learning with Honeypots

Honeypot Layout

I've recently rented some dedicated server and public IP resources for running some honeypot/honeynet/whatever setups, more or less to learn, figured I would post my game plan here.

My basic idea is not earth shattering or anything new, I just hope to gain new insight, see what works or doesn't work, and find ways of using honeypots for intrusion detection or as an early warning system for a piece of the overall security monitoring puzzle.

As we all know, any traffic hitting a honeypot system is suspicious, or not warranted at best, it whittles down the amount of traffic we have to look at compared to a production host. However, if you have ever looked at logs or traffic of a publicly accessible, non-production machine, this "whittled down" traffic can still be quite large. Both from things such as worms propagating to your annoying SSH brute force scans. So how do we both look for the unkown nasties while not wasting time on the redundant, now passe, routine malicious scans and such? One way is by filtering and tiering our honeypot architecture.

Filtering, Tiering and Multiple Tools

Fortunately, there are many great tools out there for honeypots and analysis:

honeyd: http://www.honeyd.org/
nepenthes: http://nepenthes.mwcollect.org/
honeyc: https://www.client-honeynet.org/honeyc.html
Capture-HPC: https://www.client-honeynet.org/creleases.html
Honeywall: http://www.honeynet.org/tools/cdrom/

Combined with your standard monitoring and access control tools such as snort, tshark and iptables - and you come away with many ways to both watch, contain and direct how things happen.

I have planned to heavily use VMware for the virtualization aspects of both the high interaction honeypots and some of the low interaction honeypots. Tiering between filters to low interaction honeypots, then to high interaction honeypots - reduces the load and increases the matching of known misuse early on with the least amount of resources squandered.

The Plan

So, here's what I intend to do as a starting point.

An initial box will run VMware, IPtables, and monitoring software (such as tshark/argus/snort or possibly sguil). This box will pass pre-defined traffic after being filtered to a set of IP addresses exposed to an instance of honeyd.

This honeyd machine controls a set number of public IP addresses that I intend to bind to various templates at various times - floating between Linux, Windows and dynamic emulations based on honeyd's passive fingerprinting capabilities provided by p0f signatures and other abilities (how about blacklisted source IPs for instance).

At this point, honeyd will offer some custom service emulation scripts, watch for probes and pokes on various tcp and udp ports defined, and then with the help of some perl glue, make a determination what do with it. The "what to do with it" part, will be either to drop it on the floor, pass it to nepenthes, or sending it to a high interaction honeypot (a Windows one if it is most likely a Windows exploit, a Linux one if it is most likely a Linux exploit, etc.).

The virtual machines running nepenthes and the high interaction honeypots, will be on a NAT'ed network, funneled through the public IP space offered up by the front-end of this setup. Nepenthes will provide a second-line of defense, noticing worms and malware that are already known. If nepenthes does not recognize the traffic, or if the initial honeyd setup determines that these should go elsewhere, the traffic will be destined for an appropriate virtual machine running an OS most likely to match the intended target, or potentially to an emulated service.

In addition, custom perl scripts will handle SMTP service emulation, to both capture and analyze spam and the resulting links and attachments they contain. Tarpitting and utilizing client honeypot tools to visit the linked websites, is on the agenda as well.

Things to Watch For

So many things come to mind as needing that extra care and attention, or that will just be plain fun to mess around with. Here's my list:

* Routing the traffic. Both the honeyd aspect, and the perl glue that will be used to make other determinations, etc.

* Automation. How to maintain my sanity while still providing a valuable learning environment.

* Control. As with any honeypot setup, maintaining control of the various aspects as things are exploited and probed.

* Keeping the various parts of this setup from being fingerprinted and identified as "not real".

* Building a database of everything learned, and providing a usable interface to this data.

Final Thoughts

I intend for this post to be a starting point for what I learn works or doesn't work, interesting tidbits found, etc. Both documenting things I'd like to keep tabs on and sharing with other interested parties. As always, comments and thoughts are welcome.

Much of the ideas and technical know-how came from the recent, and excellent, book on Virtual Honeypots, I highly recommend you check it out.

Tuesday, September 11, 2007

Capturing flow data from your Linksys at home


As a big believer in flow/session data collection in all NIDS locations, it is only right that there be an easy way to do so at home without putting a full-time IDS in place. So with a trusty Linksys router re-flashed with DD-WRT, an extra package installed on the router, and a suite of flow collection/analysis tools on your primary Linux desktop, we can easily achieve this.

On your Linksys:

  1. First things first. In this scenario we re-flashed a Linksys router with DD-WRT, following these instructions.
  2. Next, via the DD-WRT web interface, we enabled JFFS2 support and SSH located in subsections of the Administration tab.
  3. Moving on, update your ipkg configuration, with: ipkg update. Then install fprobe via ipkg: ipkg install fprobe.
  4. Finally, add a shell script to /jffs/etc/config/fprobe.startup. Change permissions: chmod 700 fprobe.startup and reboot your router. The file should contain the following command: fprobe -i br0 -f ip 192.168.1.100:9801
A brief discussion of the fprobe command is needed:

  • -i specifies the interface you are interested in watching flows on. I chose my internal interface.
  • - f specifies a bpf filter. In this scenario, I chose to only create flow records for IP traffic.
  • IP:Port, is the remote IP address and UDP port that you have your flow collector listening on - this will be later on your desktop Linux box.
On your Linux box:

  1. Install flow-tools from here. All that is needed, is a standard: configure; make; make install. *There is one caveat to watch out for, if you use gcc 4.x, a patch available where you downloaded the tarball is necessary.
  2. Create a directory to store your flow data: mkdir -p /data/flows/internal
  3. If you run IPTables or some other host-based firewall, make sure to allow UDP 9801 connections from your router.
  4. Finally, both run the following command and add it somehow to your system startup (via /etc/rc.local, for example): /usr/local/netflow/bin/flow-capture 192.168.1.100/192.168.1.1/9801 -w /data/flows/internal
A brief discussion of the flow-capture command is needed:

  • You specify the network interface you want your collector to listen on, then the address of the flow probe, followed by the UDP port to use - all in a local/remote/UDP format.
  • -w specifies to write out flow files to that directory. By default, flow-capture will have new ones for every 15 minute chunk of time.
So now that we have some flow data being collected to your machine, what are some cool things we can do with it? Looking in flow-tools default install directory for binaries, /usr/local/netflow/bin, we see numerous flow-* tools. We'll look at a few briefly below.

Using flow-print:

flow-print < ft-v05.2007-09-11.080001-0400

The above command will print out the results contained in that particular flow file. The columns will contain srcIP/dstIP/protocol/srcPort/dstPort/octets/packets. The octets line is the equivalent of bytes. This is your standard session/flow data.

Adding a "-f 1" flag will produce timestamps among other things. The -f flag allows for numerous types of formatting and additional columns, etc.

On a sidenote, standard *nix tools - such as awk and grep can be very useful in pulling data from plain old dumps of the flow records.

Using flow-cat and flow-stat:

Much like Argus, with flow-tools you stack together various of the utilities to get output like you want.

flow-cat ft-v05.2007-09-11.0* | flow-stat -f9 -S2

In the above set of commands, flow-cat is used to concatenate all the files that names match that criteria. The resulting output is passed to flow-stat for crunching and displaying. The flow-stat command generates reports, taking formatting options via the -f flag and sorting on both -S and -s. Our example specified a report format on the Source IP address, and sorting based on the Octet (ie. Bytes) field (have a look at the man page for flow-stat to see all the various options). Thus, we now have detailed output from all those files, showing the *noisiest* source hosts listed by most bytes transferred.

Utilizing your desktop and a router, things you probably already have at home, you too can watch/collect/analyze flow data to keep a watchful eye on your network - without deploying a dedicated NIDS or NSM sensor.

Monday, September 3, 2007

Writing Prelude LML rules

In this post, we will cover the basics of adding your own rules to Prelude-LML, which is Prelude's own log monitoring analysis engine. Highly optimized in C, Prelude-LML, comes with numerous rules built-in for everything from SSH authentication to Netscreen firewall rules.

To start we will navigate to the default LML ruleset directory, which is located in /usr/local/etc/prelude-lml/ruleset - unless you specified otherwise.

Our Example

For example purposes, we'll use the made up syslog entry below to follow along with. It shows the date, a host named some_hostame, with a service called mylogger_service, that printed some message.

Aug 22 05:22:05 some_hostname mylogger_service: We have an imortant message here.

Setting Up

The first thing you want to do is have a look at pcre.rules. The pcre.rules file, provides a way to match on certain criteria that all rules in a certain set will all match on, a lot of them are based on services, such as ssh, which allows LML to limit how many log messages are processed against which rules.

Since our service, mylogger_service, is new and no other specific rulesets apply to it, we'll add a line to pcre.rules to only apply our new rule (which we will add to its own file later, called local.rules). Adding the following to pcre.rules will do just this:

regex=mylogger_service; include = local.rules;

What this does, is only process rules in the local.rules file, if the log entry contains "mylogger_service" in it.


Adding a Rule to its own Ruleset

So now we see that we have prepped our new rule file (local.rules), to receive any log entries that contain the line mylogger_service in them. We next need to add rules to our local.rules file for further processing and alerting on any matches. Here is what we will add to local.rules for our example:

# Detect important messages from the mylogger_service.
# LOG:Aug 22 05:22:05 some_hostname mylogger_service: We have an imortant message here.
regex=important message; \
classification.text=Important Message Detected.; \

id=32001; \

revision=1; \

assessment.impact.type=other; \

assessment.impact.severity=low; \

assessment.impact.description=An important message was detected with the mylogger_service; \

last;


Stepping through this example, we see the following:

- A comment line that describes what this rule is about.
- A LOG line that shows an actual example syslog entry for what we are looking for.
- regex, that is what we are matching on, any potential regex can be used here. Such as character classes (\w,\d) or wildcards (.,*,+).
- classification.text, here is the main alert text for this rule
- id, which differentiates on this particular rule
- revision, bump this up by one as you make production edits
- impact type, which can be things such as admin, user, other, etc.
- impact severity, such as low, medium, high
- impact description, a longer description of what most likely is referenced in classification.text
- last, which basically tells LML to stop further processing if this rule matches

Many more IDMEF fields may be used, such as references or process names.

When mylogger_service is seen in a syslog entry that LML processes, it will process this entry against all the rules in the local.rules file (which is how we set this up in pcre.rules). Furthermore, if the entry matches our regex of "important message", we will get an alert with severity of low, a message text of "Important Message Detected", and the various other settings we have set.

Conclusion

This example showed a simple way of adding rules to your LML engines. You may have noticed when looking in pcre.rules, at the top is a "best practices" section on creating/adding LML rules. For much more extensive information, look here.

Friday, August 17, 2007

Threat Assessments with Argus


A useful practice for both incident response and general discovery, is the practice of threat assessments using session/flow data. My tool of choice for this is Argus, but any session/flow tool such as NetFlow or SANCP will do. For further information beyond this post, reference the book Extrusion Detection for extensive details of traffic threat assessments with both Argus and SANCP. I'll assume you are already familiar with collecting Argus data, if not have a look at the Argus labels on this blog for articles pertaining to it.

What I'll describe here for conducting a threat assessment, is what I call a blind threat assessment. What I mean by "blind", is that I am not looking for particular traffic like you would when responding to an incident - where you know a victim address, and possibly a source address and protocols. In the past during any downtime that I had, I would pick an Argus data file (which I generally rotate either daily or every X number of hours, depending on how busy the sensor collecting the data is), and pick it apart.

Let's move on to an example, reading in your Argus file of choice.

ra -nn -r /data/argus_data.arg

This pulls in and displays all the data in the Argus file, including src/dst IPs & ports, data transferred, etc. But let's apply some BPFs to it - let's say your mail server is at address 192.168.l.25, and for this assessment you don't care about traffic to/from it.

ra -nn -r /data/argus_data.arg - not host 192.168.1.25

So now on the screen scrolls by gobs of data that does not contain anything related to your mail server at that address. Next, we may decide that any web traffic is of no interest to us today - so we append more BPFs to our current one and continue to whittle down the amount of traffic displayed by the Argus client.

ra -nn -r /data/argus_data.arg - not host 192.168.1.25 and not port 80 and not port 443

Next, you realize you are seeing a bunch of ARP traffic that is of little use to you currently - so let's get rid of it too.

ra -nn -r /data/argus_data.arg - not host 192.168.1.25 and not port 80 and not port 443 and not arp

The basic premise of this blind assessment is to narrow down your view of the data until you get to various things you may never notice, such as a user running a new peer-to-peer client or a rogue MP3 server on your corporate network. You can continue to limit with BPFs, adding them on to the end of your list, or start utilizing rasort to find larger bandwidth sessions (maybe you like the noisy stuff). The whole principle of this blind threat assessment, is that there is no wrong way of doing it - stumbling randomly across some weird connection then applying a human's logic to it, is something your traditional signature-based NIDS can't do.

You won't always be able to catch everything this way, as depending on how much traffic you look at and what you decide to globally eliminate, huge chunks of traffic will never be reviewed. Nonetheless, I feel that the occasional, manual review, adds value as you usually turn up something interesting that you did not know about. So take fifteen minutes of your day or week, and notice something new.

Tuesday, July 31, 2007

Managing Snort Rules

I know many people like to use Oinkmaster to pull in rule updates, manage rules, etc. - and I am no different. But....one thing I tend not to do, is maintain numerous Oinkmaster configurations for various hosts. Let me elaborate on a rule management scheme for Snort signatures that I find easier to manage.

Let's say we have five Snort sensors deployed, watching various different types of networks and hosts - and thus requiring vastly different rule tweaks and tuning. Each of these sensors is going to require both some of the same and different rulesets and individual rules to be loaded. You could let Oinkmaster handle this or you could use thresholding within Snort itself.

Example Architecture:

  • Download new Snort signatures daily from snort.org and BleedingThreats via Oinkmaster, disabling rules that you globally do NOT use (with disablesid lines).
  • Run these new rules through a loaded Snort configuration (basically a config with most everything turned on), in testing mode ( -T ). Potentially quarantine or notify a rule maintainer that new rules are available.
  • If the new rules pass the Snort testing phase, make these rules centrally available - possibly via a revision control repository, scp, or packaged (rpm, deb, etc.).
  • Have your sensors check for new signatures at various intervals (using revision, timestamp, or version to decipher if a new ruleset is available). Let Snort restart with the new rules.
Here's the per-sensor tweak:
  • Utilize thresholding in Snort to suppress or threshold rules that affect less-than-all of your sensors. Have a look at threshold.conf that comes along with the Snort tarball.
So essentially, this approach, relies on one server to update and maintain centrally, new Snort signatures. A rule that can be removed from all sensor configurations is done so at the Oinkmaster level, while rules that affect anything but all of the sensors is handled at the sensor level in threshold.conf.

Here is the caveat and where many people take exception to this process: it isn't as efficient on the Snort detection engine itself. When rules are removed at the Oinkmaster level, they are never loaded into the Snort configuration. However, when suppressed via Snort thresholding, it happens post-processing (ie. Snort has already detected a hit on the rule, and it then decides it should be suppressed).

So the moral of the story is, if you have the spare cycles in beefy sensors that are not bogged down with the traffic they are watching - then you can benefit from the administration ease and having rule modifications stay close to the sensor for view, etc. If your sensors are already taxed, you should really use Oinkmaster all the way through.

Monday, July 23, 2007

High Availability Prelude Central Services

I recently posted to the Prelude wiki, a sample configuration for providing high availability for your central Prelude services.

Basically what the configuration provides is a setup across two servers to host these services: Manager, Correlator, Apache, MySQL, and Prewikka. It is purely a fault tolerant scheme, as opposed to a performance booster. Although, you could spread the load to increase performance - such as with a split of the web interface to one while the other provides database interaction for incoming events, or offloading things such as reporting and backups to the secondary.

MySQL v5 is required to avoid potential auto increment collisions when doing multi-master replication. Other than that, there really should be minimal changes needed for using various versions with regards to the other software pieces. Either host in the pair, is capable of taking over as the primary - only caveat is heartbeat is for machine failure, not service failure. So....you will still need your application-level monitoring (ie. Nagios or other snmp-based solution) in place to be notified of service issues.

Saturday, July 14, 2007

Changes of the Seasons


When the seasons change in New England, there are distinct things you notice - such as the chill in the air as the leaves change in fall, to the rainy months of early spring. Most changes are anticipated, but as New England weather goes, you always expect the unexpected - you can just as easily get snow in April or have warm January days. Where I am going with this is in relation to Network Awareness, the ability to notice changes, additions, etc. from endpoints on your network - whether this is new ports, increased protocol activity, or just actively getting to know the hosts making use of your network.

Much like the weather in New England, the network activity of your hosts is at many times predictable, but there are also the numerous anomalies that appear every day - hosts that shouldn't be running a web server, or increased activity from an IP address. Alerting on, and profiling these anomalies, is what I am getting at with this Network Awareness approach. Basically, utilizing existing tools (nessus, nmap, p0f, etc.), with storage (mysql, text, etc.), and custom tools (perl, c, etc.) to build profiles, notice trends, and generate alerts.

Maybe there are open source tools already in the this space (do you know of any?), but it also is a task that benefits from the flexibility of a home-grown process - as each network and set of endpoints is so vastly different nowadays.

Things of interest (have any others?):

* Build profiles and store all interesting events in a database, both for maintaining history, state, and future correlations

* Analyze various sources of data for various types of items

* Sources of Data:
  • nessus: both for assessing and verifying compliance, provides a baseline
  • nmap: actively profile port openings and OS detection
  • p0f: passively identify OS
  • tshark: for traffic profiling and statistics
  • pads: passively noticing new services offered
  • argus: counting hosts, ports, traffic, etc.
  • various others, including netics or fl0p
  • custom: for mining logs, running comparisons, etc.
* Important Items:
  • tcp and udp ports
  • ip addresses
  • services offered on those ports
  • identifying operating system usage
  • traffic patterns
  • establishing normal usage profiles on traffic, endpoints, and potentially users of those endpoints
* Establish signatures to build these profiles, notice trends, and spot anomalies


This is not an idea based on real-time alerting or analysis, but a crunching of various data to cast a light over areas that deserve attention or investigation. I guess the operative word here is change. Change can be good, especially when making improvements, but in our context, we are looking for those changes that indicate something unauthorized or outside the scope of a security policy. Services and people many times operate in a set pattern with noticeable characteristics...let's find the anomalies.

Friday, July 6, 2007

Brute Forcing SSH Passwords with Hydra


Quite often you may find the need to audit passwords without grabbing a copy of the hashes, or maybe need to generate a simulated brute force attack to test one of your sensors or correlation engines. In from stage left steps THC-Hydra, the self-described "very fast network logon cracker which supports many different services."

If you are familiar with BackTrack, running Hydra from within is quite easy, located under the online password cracking tools. Otherwise, Hydra can be built from source, just make sure to have openssl and ssh libraries installed for it to be compiled against - as usual, the configure script will let you know which libraries are lacking on your system.

Much like nmap, and the gui front-end for it, Hydra can be run from either the command-line or with a simple GTK gui wrapper. The only change necessary is to have X working, and specify xhydra as opposed to just hydra. I'll use the command-line options in this post, as the gui makes it extremely easy to figure out the options, etc. In fact, using the gui will actually build the hydra command-line for you to see how it is configured to run.

Numerous services are supported for cracking in the latest version of Hydra, which is 5.4 at the time of this post. Although we will use ssh2 in this example, other network services such as cvs, ftp, imap, mysql, ldap, and http are also available. So let's move on to running an over-the-air ssh password attack (exercise caution if you lock out accounts, or have other account policy settings in place)

A simple one-off username/password combo:

hydra 192.168.1.25 ssh2 -l foohacker -p bluebird

The above attempts to login over ssh v2 to 192.168.1.25 as foohacker with password of bluebird.

Quick alteration to utilize lists:

hydra -M targets.txt ssh2 -L users.txt -P passwords.txt

So...now we have replaced the single setting for each and allowed ourselves to brute force ssh login with a matrix of users, passwords, and hosts. I specify a single item per line in my flat text files when using these lists.

A couple options worth mentioning:

-f allows you to exit hydra once a match is found
-t allows you to manipulate the number of tasks it runs in parallel. from the readme, experimenting with this feature can result in improved speed or in disabling the service, :)

Have a look here and here, to learn more about the options, download source, and view changelogs.

Sunday, July 1, 2007

Prelude Registration Server


As anyone who has used Prelude, you will know that registering a sensor with a Prelude Manager/Relay, is the first step in having your sensor send alerts into your Prelude framework. Usually a combination of, (a) running 'prelude-adduser registration-server' on the manager/relay, and (b) running 'prelude-adduser register' on the sensor you are adding - followed by accepting the registration on the manager, etc.

In this post, I will show a quick way of setting up a pseudo-daemonized instance of the Prelude registration server, that will auto-accept the sensor registration. This comes in handy when you have a bunch of sensors to register, yet you don't want to constantly be going back to the manager console to acknowledge each individual sensor registration.

On the manager side, first install the screen utility.

Continuing on the manager machine, I usually create an init script, that has the process being the following:

/usr/bin/screen -d -m /usr/local/bin/prelude-adduser registration-server prelude-manager --passwd=somepassword --keepalive --no-confirm

What this command says is, have screen fire up this prelude command while detaching the screen session - thus putting it in the background, much like a daemonized process (ie. not running active in your console). The 'prelude-adduser registration-server' command runs using the prelude-manager analyzer profile. The key additions to the command, are the use of a pre-shared password, and the keepalive and no confirm options. The pre-shared password is used by the sensor registering, and the no confirm eliminates the need to accept the sensor registration on the manager each time. Finally, the keepalive option, does not cause the registration server to exit after a single successful registration on the manager side.

Finally, running the following on the sensors needing to register (in this example, a snort sensor):

prelude-adduser register prelude-snort-profile "idmef:w admin:r" 192.168.1.2 --uid snort --gid snort --passwd=somepassword

The above does the normal sensor registration pieces of specifying the profile in use, prelude permissions to use, and user/group to allow access to the sensor profile. The important addition, is the use of the pre-shared password that was specified in the registration server running on our manager.

Friday, June 29, 2007

Snort starter configuration

Everyone has their own ways of configuring up a new Snort IDS sensor, below is a glance over the base options that I feel should be given some attention when first deploying. This applies to the 2.6 strain of Snort.

HOME_NET variable

var HOME_NET [192.168.1.0/24,192.168.25.25]

The general rule to keep in mind when setting the HOME_NET variable is to specify the networks or hosts you are protecting. For example, if watching a gateway where your local network resides on one side, and the Internet on the other - HOME_NET would be set for your local network address.

EXTERNAL_NET variable

var EXTERNAL_NET !$HOME_NET

I generally set my EXTERNAL_NET variable to be anything not in my HOME_NET. Essentially, anything that is not in the "protected" zone for this sensor. There are exceptions to this rule, for example, a highly subnetted internal network that may have other sensors watching elsewhere or that you generally are not interesting in watching traffic from with a network IDS.

Service-specific variables

var DNS_SERVERS [192.168.1.5,192.168.1.6]
var SMTP_SERVERS [192.168.25.50]

var HTTP_SERVERS [192.168.1.100,192.168.1.101]


Next comes the groupings of service-specific variables. There are two main reasons for getting these as accurate as possible pertaining to the network you are watching with this sensor. First, they will make the potential alerts more accurate - think less false positives, because you are only looking for DNS-related alerts against DNS servers (if the rules are written with these variables used of course). Second, they will make your Snort engine more efficient. Instead of applying certain rules against all IP addresses, if a rule is written to watch for a certain HTTP exploit and specifies the HTTP_SERVERS variable in the rule, it will only be applied against those specific servers. Any limits you place on what Snort has to match against, speeds up the whole process.

Service-specific port variables

var HTTP_PORTS 80
include coldfusion.rules
var HTTP_PORTS 8080
include coldfusion.rules

I won't spend time here, but the same principles that apply to the service-specific variables for IP addresses in the section above, also apply here for various ports. *Note that each port definition must be defined separately and with each rule set bound to it, unless using contiguous ports - such as 80:85.

Detection Engine memory usage

config detection: search-method ac-bnfa

Various options can be used here that both directly affect the performance of the detection engine and the resources it uses. Utilizing ac-bnfa is becoming both the default recommended setting from various sources, and I can attest to having the best globally acceptable expectations across numerous platforms and hardware. It is rated at "low memory, high performance".

frag3 preprocessor

preprocessor frag3_global: max_frags 65536
preprocessor frag3_engine: policy windows bind_to [192.168.10.0/24]
preprocessor frag3_engine: policy linux detect_anomalies

The frag3 preprocessor handles IP fragmentation and attempts to thwart the various IDS evasion techniques that utilize fragmentation. The key thing I want to point out here, is the policy bindings. Different operating systems, implement TCP/IP in different ways, and thus handle IP fragmentation in different ways. The frag3 preprocessor is a target-based preprocessor that allows you to let the IDS see the reassembled packets in the way the target OS will. The first policy statement above applies a "windows" policy, which Windows happens to follow for example. The last policy statement without the bind_to, applies to all other target IP addresses other than our 192.168.10.x network.

Perfmonitor preprocessor

preprocessor perfmonitor: time 300 file /data/snort/snort.stats

As its name implies, this preprocessor measures performance. Things such as CPU usage, packet counts, and my favorite - drop rate, are measured here. The above configuration line tells the perfmonitor preprocessor to write out statistics every 300 seconds to that particular file.

sfportscan preprocessor

preprocessor sfportscan: proto { all } ignore_scanned { 192.168.1.22 }ignore_scanners { 192.168.1.150 } sense_level { low }

Not everyone feels it necessary to run this preprocessor, especially on internal network segments, where portscans should be less of an issue - but a few tuning options can go a long way. Utilizing the ignore_scanned and ignore_scanners options, can reduce portscan alerts generated by sensitive targets or sources - for instance a vulnerability assessment scanner. The sense level can be raised to higher levels to detect slow scans, but at the expense of generating more false positives - whereas setting to low will only watch for error responses from the targets of a potential scan, making this option much less noisy.

Removing unnecessary rule sets

include $RULE_PATH/smtp.rules
include $RULE_PATH/coldfusion.rules


One of the best ways to improve performance of your sensors (ie. reduction of dropped packets), is to globally remove rule sets that are not pertinent to the hosts you are protecting with this sensor. For example, do NOT include coldfusion.rules if you do not have ColdFusion servers you are protecting. Remove or comment out those rule sets that are not necessary from your snort configuration altogether.

Use of Bleeding Threats rule sets

No:

include $BLEEDING_RULE_PATH/bleeding.rules

Yes:

include $BLEEDING_RULE_PATH/bleeding-attack_response.rules
include $BLEEDING_RULE_PATH/bleeding-dos.rules


Much along the lines of globally removing rule sets that do not pertain to your environment, is if you decide to use Bleeding Threats rules, do not use the large, all inclusive bleeding.rules. Select only the individual rule sets that you are interested in using.

thresholding/suppression

suppress gen_id 1, sig_id 1231, track by_src, ip 10.10.10.10
suppress gen_id 1, sig_id 573, track by_dst, ip 192.168.1.20

I will get into this area in a future post in much more depth, but utilizing threshold.conf for both thresholding and suppression can be extremely beneficial. If you have a Nagios server that constantly trips an alert for an SNMP rule against a certain router, consider utilizing a suppression to remove this particular instance from alerting, while still allowing other hosts to trigger this rule.

Conclusion

There are numerous configuration options within Snort, and this post only touched upon the few that I feel are most immediately useful with the tweaks above. Every sensor and network is different, for example, performance tuning the stream4 preprocessor or tuning http_inspect for particular ports, will be more or less important in various situations. Utilizing a base Snort configuration, tweaking as necessary to tailor for both resource constraints (bandwidth, processor, memory) and network profile (types of servers and traffic, nature of environment, etc.), will make your Snort IDS sensor much more useful.

Saturday, June 23, 2007

How NSM Saved Christmas

Introduction

'Twas the night before Christmas....well...not exactly. This is a real-world account of how I used open source tools and the foundation of Network Security Monitoring to save my chances of attending the company Christmas party. It was a few years ago in the middle of December when the incident that follows occurred, only but a couple hours before I was set to attend the party. Luckily, the practices of NSM were already in place, trimming down the time needed and stress endured considerably, while scoping the extent of the damage.

For those not familiar with the concept of NSM, I highly recommend the blog and books of Richard Bejtlich, security guru and NSM evangelist. The basic principle that NSM boils down to, is to not rely on a single point of network data for detecting and responding to your intrusions. So instead of collecting only alert data from your IDS, you supplement this alert data, with session or flow data, full content, and potentially statistical data.

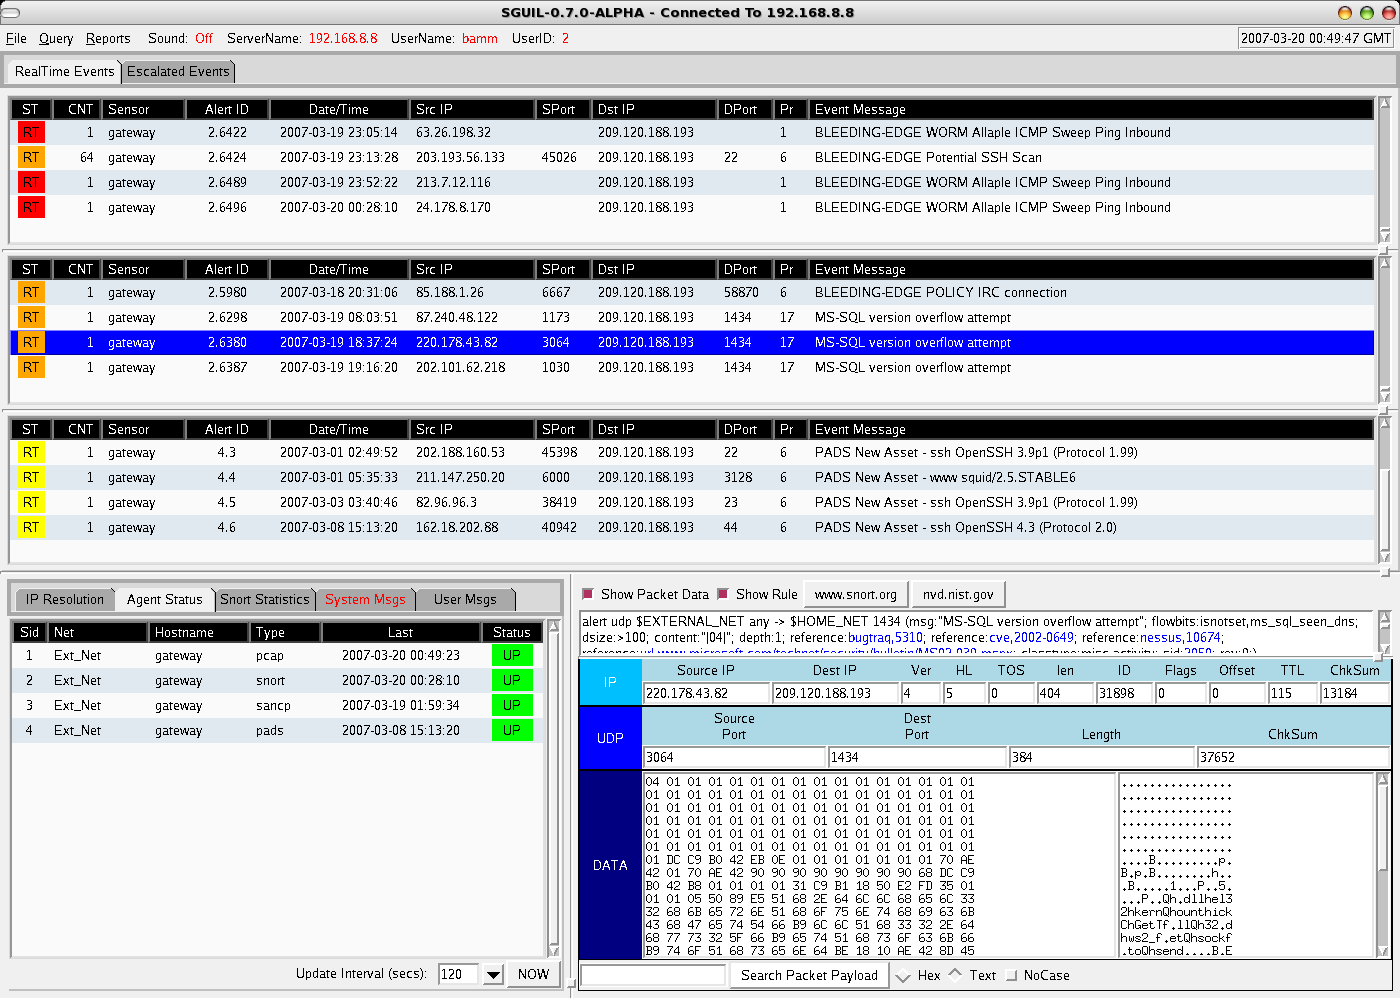
In the scenario that follows, NSM was employed using various open source tools, including Sguil, Snort and SANCP. If you have never used Sguil before, you are in for a treat - as it ties together the Snort alerts, with corresponding SANCP session data and another Snort instance capturing full content data.

The First Hint

"CHAT IRC channel join", those four words is how it all began. Normally, a Snort alert of that nature would not have caused me much concern - mainly, since many co-workers and myself used IRC on a daily basis. The source IP address, however, made it all the more frightening. It happened to be a Debian FTP server we had in our DMZ, which would have absolutely no reason to be running an IRC client legitimately. Could it be an employee that was doing work on the server, deciding to install an IRC client on it and connect from there? Or, was it something more sinister, like that of a compromised Linux box joining a botnet?

The first thing that led me initially away from it being an insider doing something they should not be, was in the packet payload - viewable via Sguil from the Snort alert data collected (a sample Sguil packet view of a generic alert is shown here on the main Sguil site). A random jumble of characters for the nick used to log onto the IRC server, this is seeming stranger by the minute. Why would someone that worked here use a random character string and join a channel that did not make any more sense than the nick? From knowledge of working on the FTP server recently, I knew that there was a limited exposed attack surface, only TCP ports 21 for FTP and 22 for SSH were listening.

In an all too common occurrence when an IDS is deployed, our investigation without touching the server in question would most likely be over. Sure, we could have been collecting logs centrally or had some sort of host IDS installed, but using network sensors that were collecting various data, allowed us to solve this from a 3rd party point of view at the network level. Luckily for us, we had NSM already in place, so in addition to the Snort alert we saw, we were able to dig deeper into the session (ie. flow) data and full content data to further analyze what exactly was taking place.

Tracking Down the Compromise

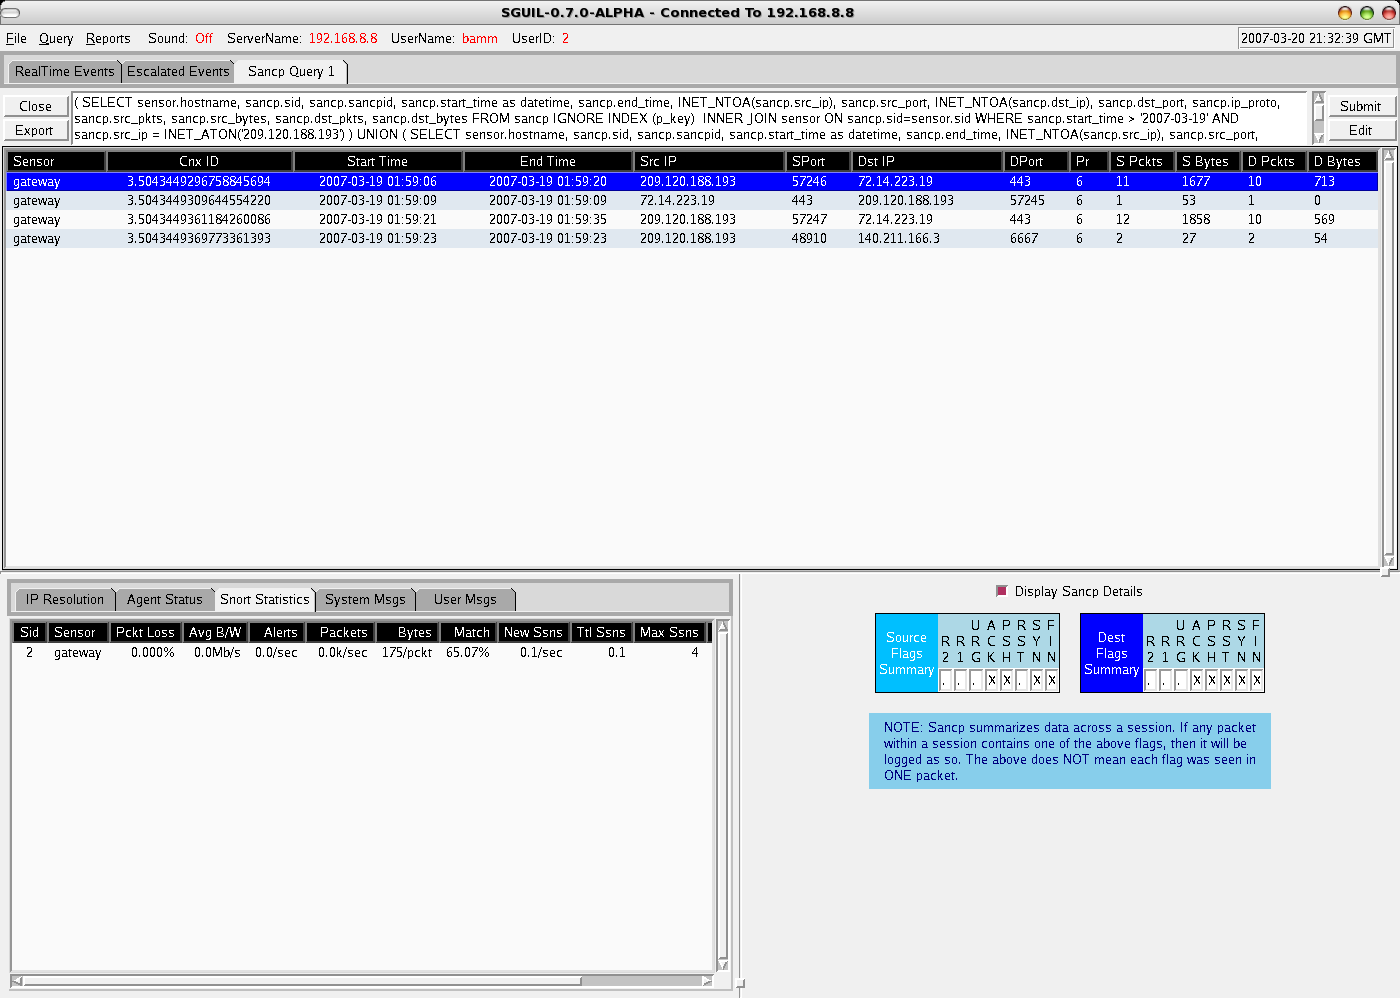
So where did I go from here? Well...I first decided to query for any Snort alerts, on both the source and destination IP addresses for the last week - nothing of any use came back. The next step was to pull any session/flow SANCP data from Sguil's database of all connections in the last week involving our victim machine. Sguil's SANCP view, looks like this sample from the Sguil website, and includes data formatted with the following headers:

Start Time End Time SrcIP SPort DstIP DPort SBytes DBytes

From the SANCP data returned, we could see numerous connections from external addresses with very little data being exchanged to tcp port 22 of our victim machine, especially from the destination side (this is classic of SSH brute force attempts, and confirmed from central logs from the victim host). The real interesting flow results, were the sudden stop of excessive SSH connections, followed by a connection to an external FTP server and a public IRC server! Now we are getting somewhere!!

One of the best things of working with Sguil, is that we can right-click any SANCP session and request the full-content data related to it (either in full capture view via Wireshark or output in a transcript window if an ASCII-based protocol, such as HTTP, SMTP, FTP, etc) . Within a traditional Sguil setup, you have a separate instance of Snort constantly recording pcap data to hourly files, which Sguil then applies the appropriate BPFs to get the correct data requested by the analyst using the Sguil client.

With full-content data at our disposal, we immediately requested the transcripts of the IRC and FTP sessions (a sample generic transcript screenshot can be seen here from the main Sguil site). Within the FTP transcripts we notice various tarballs being downloaded (with names of not any popular software), which ironically, can be fully regenerated from the full-content data we have collected with open source tools - but that is a topic for another post. Furthermore, the IRC transcripts confirm our earlier IDS alert that suggested the victim host had in fact joined up to the popular Freenode IRC network, joining both an obscure channel and with an equally obscure nick. Forensics performed later on a copy of the hard disk showed a custom IRC client with various "enhanced" drone abilities.

So what did we learn here? As you can see, having full content data made diagnosing the issue at hand, extremely easy. But what if you don't have full content data or all the communication had been encrypted?? That is why the flow data is so important. Even eliminating the full-content analysis we did above, we were still able to find out various important things just from SANCP flow data, enough to get a sense of what had happened, including:

1. Noticing plenty of source-heavy, quick SSH connections from external addresses - implicating SSH brute force attempts to login against an account.

2. A sudden stop in the rapid SSH connections, followed by an FTP connection to an external IP address and pulling substantial amounts of data to the victim system.

3. Connection to IRC, from a machine that shouldn't be.

Scoping the Extent of the Incident

The final step before taking this machine out of service, to both be forensically analyzed and rebuilt from known good sources, was to scope the extent of the damage.

Once again, we turned to the flow data in Sguil provided by SANCP. The following steps gave that "warm, fuzzy feeling" that we were okay:

1. Lookups across the SANCP database table that involved any communication from all external IP addresses involved. This included, the original SSH brute force scanner, which also happened to be the box they logged into SSH with once successfully cracking a password. Also the FTP server the tools were grabbed from and IRC server they connected to. Nothing beyond the time frame and machines we had already been investigating gave cause for alarm.

2. The victim machine, our Debian FTP server in the DMZ, had its IP address searched across all of the SANCP data available as well - with importance placed on connections both 72 hours prior to the successful compromise and anything thereafter. With importance this time placed on looking for such things as attacks on other DMZ hosts of ours in the same accessible subnet, to scanning of external hosts on strange ports.

3. Finally, a search across the SANCP table for other hosts in the same DMZ subnet. Looking for any protocols used or communications that appeared out of the norm.

Having centralized logs, HIDS, rootkit checkers, etc. are an ideal situation to compliment network based evidence, but if given the choice, a properly deployed NSM sensor is my first course of action when responding to intrusions. Just utilizing our NSM tools, we determined what happened to the machine, what it did, and scoped the extent of the intrusion.

After finishing our network-based analysis, we had a look at our central log server. The syslog data confirmed, shortly after the brute force attacks, and at the same time as the network data showed the last bits of SSH communication - a successful login on an unprivileged account. The files downloaded via FTP to /tmp, which included the custom IRC bot client, all with permissions and ownership of this compromised, unprivileged account. A successful grinding of a weak user account password over SSH had been the way in, with the common post-attack scenario of it being joined to a botnet army of drones, the result.

Conclusion

Hopefully this article has sparked an interest in enabling your IDS sensors to do more, and provide you with a broad way of investigating incidents. Once you move away from the alert-only mentality of a traditional IDS, you will find even more value in the data that tools like Sguil provide. For more information on NSM and the various tools that can be used, I point you again to Richard Bejtlich's books and the Sguil/NSM wiki.

* All of the network forensics (ie. non-local), were completed in only a couple of hours, leaving plenty of time to have fun at the Christmas party!

Friday, June 15, 2007

Incident Response: Breaking the Cycle

An alert comes into your email inbox, notifying of a possible intrusion noticed by one of your sensors. What do you do next? Unfortunately, a common answer to this question, is the analyst rushes to logon to the machine that is potentially breached - which is exactly the WRONG thing to do!

I guess it is human nature to readily go to an ailing object, in our case the victim system. But, when doing so in responding to possible intrusions, you potentially contaminate evidence, or possibly alert the intruder that you know of their existence - losing the upper hand you currently possess in organizing your plan. Even if you do go to that victim machine and start running commands such as 'w' or 'ps -ef', how can you trust their output - trojaning system utilities is a common reinforcement procedure after a successful compromise.

As I have discussed in a previous post, having a robust security monitoring infrastructure is imperative to your noticing and responding to incidents. With centrally located data, you can form a much clearer picture as to what could have happened, or set your mind at ease that nothing has happened - all without touching the victim machine.

So what are some ways to use our security monitoring infrastructure for IR:

Flow data: If you collect flow data, from say Argus, SANCP, or even Cisco Netflow - you could have all the connections that both the source machine and victim machine have made. Querying for what other hosts, ports, and how much data has been transferred are all helpful clues. You may notice strange connections to IRC servers, or large amounts of data transferred over FTP. Flow data can prove invaluable when you don't have access to collected full content data, due to technical or political limitations.

Network IDS Alerts: They aren't just for real-time alerting! Why not search your recorded IDS alerts for previous hits on your victim's IP address or maybe the attacking source's network address. Any otherwise insignificant alert like a portscan, may provide better context to the investigation at hand.

Logs: Both system and application logs can play a huge part here. The key point that needs to be made, is these logs must be collected centrally. They are too easily removed from the "hacked" machine if so desired by an attacker. Logs can show you who logged in recently or what account may have been compromised for instance.

HIDS: If you run a HIDS, you may have file modification alerts - noticing an addition to /etc/passwd or a change to your DNS resolver. These alerts and your system logs may be your only concrete evidence if an encrypted channel such as SSL or SSH is being used.

Having some sort of SIM/SEIM or Event Management system, allows you to review these alerts from one interface, cross-reference, or correlate. Sometimes, logging onto the victim machine will unfortunately be your only option - for instance, if an important clue is only available in running memory on the system. When you get to this stage, remember to always use trusted read-only media with the tools you require. The most important point to take away from this post, is to exhaust your options BEFORE touching the victim machine.

Sunday, June 10, 2007

Prelude-LML as a UDP Listener


If you have ever used Prelude's Log Monitoring Lackey (LML) before, you probably know that the default behavior is to process these log files that happen to be local to the server. What I will show in this post, is how to set Prelude-LML to listen on a UDP port, and accept messages there from Syslog-NG or anything that can transport the messages to it via UDP.

Having Prelude-LML listen for UDP messages, is as easy as adding the following to your startup options:

--format syslog --udp-server=192.168.1.25:10514

Basically, what the above says, is for the Syslog format, listen on the interface with IP address 192.168.1.25 for UDP messages on port 10514. Listening on UDP, can also be specified in the format section in prelude-lml.conf of your choosing, whether a format for Syslog messages or maybe Apache log formats, etc.

So now you have a Prelude-LML instance listening for UDP port 10514 messages on its appropriate network interface. Let us also assume you already collect your Syslog data from all your hosts in your environment centrally via TCP, to a server running Syslog-NG. All you need to add to your Syslog-NG configuration would be something similar to the following:

destination d_prelude_lml{ udp("192.168.1.25" port(10514)); };
log { source(s_tcp); destination(d_prelude_lml); };

The above assumes, you already collect your logs centrally from all hosts via TCP, and have labeled the source as s_tcp in your Syslog-NG configuration - adjust accordingly. We created a new destination call d_prelude_lml, pointing it to use udp with our IP and port combination we setup on our Prelude-LML server. The log statement we have added, combines the source TCP statement, with our new Prelude-LML destination statement to send any logs coming into our Syslog-NG central log server from hosts over TCP out over UDP to our LML instance. Allowing all the logs to be processed via Prelude-LML, but without, for instance, being stored on our LML server.

Prelude-LML is highly configurable, many more options and combinations can be made to tailor it for your environment. I hope this provided one option of adapting it to an architecture that already collects their Syslog data centrally.

Thursday, June 7, 2007

Prelude for Event Management (ie. SIM)


The hybrid IDS, or "meta-IDS", as described by the project's founder, makes an excellent choice as a SIM/Event Management tool in what is a sparse area of the Open Source world. Not only is it "good enough" to justify not throwing hundreds of thousands of dollars at an Arcsight or Network Intelligence solution, it has far exceeded my expectations in many areas.

I'd like to commence this first post on Prelude, by detailing five things that I most like about it. In no particular order, let us begin the Prelude Five.

** The Framework **

When Prelude first started out, it was very much an IDS, with a NIDS of its own, etc. But realizing that the framework itself was the crux of this project, was probably the wisest design decision made.

From deploying and configuring numerous sensors, from Samhain to Snort, the Prelude library makes it seamless to connect agents/sensors into the existing framework. TLS encrypted channels secure the data in transit, from your agents to Prelude Managers at a central site or in a relaying configuration to distribute the load. Registration of the individual agents/sensors/relays, allows you to only accept and connect systems that you specifically specify.

The distributed architecture allows for various systems, along the route to your central site, to spool events and data when various relays, etc. are unavailable. Both allowing you to spread out your load, and have fault-tolerance baked in.

** Versatile API **

Have a sensor or tool that has data you want sent to Prelude and it isn't one of the natively supported sensors? No big deal! Prelude's API allows you to use C, Perl, or Python to format your alert/event in IDMEF and pump it into the Prelude framework. Install the Prelude library, format the data appropriately, and use one of the languages to create your client and away you go.

**Prewikka**

If there is one thing that the Open Source world of projects frequently lacks, it is a nice GUI interface. Prewikka, the web interface to Prelude, is one exception to this statement.

The ability to view alerts, drill-down to event data, view agents - and not to mention the additional features in a commercial add-on (that includes graphs, stats, ticketing, reports, etc.). The Python-based code, runs either as a CGI program, mod_python module or within its own self-contained web daemon. All in all, a very well thought out interface that is both usable and constantly improving.

**Analysis Engines**

Two analyzers that come with Prelude, are the Correlator and LML (log monitoring lackey).

Let's say you want to analyze your syslog data or even your windows event logs (exporting them via ntsyslog in a syslog format), this is what LML is for. Heavily weighted in regular expressions, you generate alerts from your logs on failed SSH logins, firewall events, mail system abnormalities, and all the usual suspects that make up a standard log analyzer. But here's the real catch....most of these open source log analyzers are written in Perl, while LML is "highly optimized" in C! I've personally seen LML with the default ruleset not break a sweat on thousands of large syslog messages per second, when SEC (a very fine pattern matching program itself) get brought to its knees with a much smaller, tuned ruleset.

Then there is the Correlator, still technically not released officially, and with a very minimal ruleset at the moment, but nonetheless extremely usable. What would an event management solution be if it couldn't take in Snort alerts, and correlate them with firewall or syslog events. This is just what the Correlator does, by leveraging Prelude's heavy reliance on the IDMEF RFC for event format, allowing correlation across any of the fields.

Best of all, both with Correlator and LML, you can add/change/delete rules as you see fit. No black box, enable or disable only options for you - this is Open Source my friend!

**Modular Plugins**

So you want to pump your data into a database, who wouldn't....so enable the database plugin, make a few changes, and presto. Maybe you don't want to log to the database and you want all your alerts in a flat text file, sure that can be done. Or you could purchase, for minimal dollars, the SMTP alerting plugin to send alerts to you via email.

All the plugins are enabled/disabled in the Prelude Manager, and allow various things to happen with this data you are gathering in from your various sensors. Remove what you don't need, and add what you do - you have full control of this.

If modular plugins aren't enough, you can stack them too. Stacking the plugins allows you to take the benefits of one plugin, say the filtering capabilities of the IDMEF-Criteria plugin, and hook it to the Thresholding plugin (limiting the number of events processed), then hooking that to the Database plugin. Effectively, creating a stack of plugins hooking into the next to manipulate a chain of events as you see fit, on the exact events or data that you require.

As you can see, Prelude has plenty to offer in the Event Management/SIM space, is actively developed and supported, with both an Open Source community and a commercial outfit providing both support and enhancements.

Friday, June 1, 2007

Argus: The Basics

When regular network IDS alerts aren't enough, and turning to full content data is not an option - the use of flow data can prove useful in tracking down the connections, bandwidth usage, and intents of particular hosts. Argus fits the bill as a lightweight, yet fully featured, bi-directional flow suite of tools.

Capturing data can be as simple as this:

argus -d -i eth0 -w logfile

Where -d starts argus as a daemon, -i specifies the network interface to capture on, and -w tells it where to write out its data to. Scripting the restart, naming of the output files, etc. allow for a more robust collecting scheme and more manageable file sizes.

Now let's say you want to look for a certain host communicating. You could do something as simple as this:

ra -r logfile -nn - host 10.10.5.4

This uses the argus client (ra), to read the logfile with -r. The -nn tells argus to not resolve IP addresses to hostnames, and to also not translate port numbers to service names - making the processing of the file that much faster. The pieces that follow the last (-), can be any BPF filter, with any number of combinations. The BPF used above, simply says, only include records that have IP address 10.10.5.4 as the source or destination. Various other ra* clients exist, for various different uses - as we will get into below.

Output from the above example could look like this:

01 Jun 07 14:01:22 q tcp 192.168.1.25 -> 10.10.5.4 7 1236 FIN
01 Jun 07 14:01:31 q udp 10.10.5.4 <-> 192.168.10.10 13 1411 CON

The ra client displays various useful information, such as a timestamp, protocol, source & destination ports and IPs, source and destination bytes transferred, and last known established state or pseudo-state.

Let's move on to a more complicated example, combining various argus clients to pull together some data that we may be interested in. Combining argus clients, to process the outputs of each sequentially allows much more powerful results.

Since argus takes a best guess as to an established flow or session, ragator, aggregates the various flows into what it thinks a "conversation" may contain - by combining flows it believes go together. Let's run it as so:

ragator -r logfile -nn -w tempgator - host 10.10.5.4

We read in our logfile with ragator, this time writing out our results to a new file called tempgator. Ragator aggregates the flows into "conversations" containing our host 10.10.5.4 in either the source or destination IP. This data could be useful to get a bigger picture, maybe seeing large transfers, etc. But let's now process this file through ramon to find our top pair of talkers with 10.10.5.4 being one on either side.

ramon -r tempgator -nn -w tempmon -M Matrix

In the above, ramon processes the ragator file, and finding the top pairs of talkers by bytes. Various other options can be passed to the -M option, such as finding only the top 10 talkers, etc. We will then process this resultant file through rasort to list our top talker pairs in a more orderly format.

rasort -r tempmon -nn -M saddr bytes

What we did here was tell rasort to list, in order, first by the source IP address, then by total bytes transferred the top talkers' conversations. Quickly identifying who were the largest bandwidth hoggers from our resultant argus capture file. Numerous sorting options are available to rasort via the -M option.

One other useful client to mention is racount. Racount will take a statistical snapshot of the file that you process to give you some higher level protocol breakdowns. As an example, run:

racount -ar logfile

This will give statistical counts of IP, TCP, UDP, etc. breakdowns of packets, bytes, etc. Useful for determining what the general makeup of this argus captured file is.

Argus includes many options, as this was only a small sampling of options available. Furthermore, v3.0 will introduce racluster which greatly simplifies the various steps needed to take to get data in the format that other argus clients act upon.

Basic Pig usage to process Argus data

Some quick notes on testing out Pig in local mode to process some basic Argus data. Argus Capture a sampling of network traffic with Argus a...