Everyone has their own ways of configuring up a new Snort IDS sensor, below is a glance over the base options that I feel should be given some attention when first deploying. This applies to the 2.6 strain of Snort.
HOME_NET variable
var HOME_NET [192.168.1.0/24,192.168.25.25]
The general rule to keep in mind when setting the HOME_NET variable is to specify the networks or hosts you are protecting. For example, if watching a gateway where your local network resides on one side, and the Internet on the other - HOME_NET would be set for your local network address.
EXTERNAL_NET variable
var EXTERNAL_NET !$HOME_NET
I generally set my EXTERNAL_NET variable to be anything not in my HOME_NET. Essentially, anything that is not in the "protected" zone for this sensor. There are exceptions to this rule, for example, a highly subnetted internal network that may have other sensors watching elsewhere or that you generally are not interesting in watching traffic from with a network IDS.
Service-specific variables
var DNS_SERVERS [192.168.1.5,192.168.1.6]
var SMTP_SERVERS [192.168.25.50]
var HTTP_SERVERS [192.168.1.100,192.168.1.101]
Next comes the groupings of service-specific variables. There are two main reasons for getting these as accurate as possible pertaining to the network you are watching with this sensor. First, they will make the potential alerts more accurate - think less false positives, because you are only looking for DNS-related alerts against DNS servers (if the rules are written with these variables used of course). Second, they will make your Snort engine more efficient. Instead of applying certain rules against all IP addresses, if a rule is written to watch for a certain HTTP exploit and specifies the HTTP_SERVERS variable in the rule, it will only be applied against those specific servers. Any limits you place on what Snort has to match against, speeds up the whole process.
Service-specific port variables
var HTTP_PORTS 80
include coldfusion.rules
var HTTP_PORTS 8080
include coldfusion.rules
I won't spend time here, but the same principles that apply to the service-specific variables for IP addresses in the section above, also apply here for various ports. *Note that each port definition must be defined separately and with each rule set bound to it, unless using contiguous ports - such as 80:85.
Detection Engine memory usage
config detection: search-method ac-bnfa
Various options can be used here that both directly affect the performance of the detection engine and the resources it uses. Utilizing ac-bnfa is becoming both the default recommended setting from various sources, and I can attest to having the best globally acceptable expectations across numerous platforms and hardware. It is rated at "low memory, high performance".
frag3 preprocessor
preprocessor frag3_global: max_frags 65536
preprocessor frag3_engine: policy windows bind_to [192.168.10.0/24]
preprocessor frag3_engine: policy linux detect_anomalies
The frag3 preprocessor handles IP fragmentation and attempts to thwart the various IDS evasion techniques that utilize fragmentation. The key thing I want to point out here, is the policy bindings. Different operating systems, implement TCP/IP in different ways, and thus handle IP fragmentation in different ways. The frag3 preprocessor is a target-based preprocessor that allows you to let the IDS see the reassembled packets in the way the target OS will. The first policy statement above applies a "windows" policy, which Windows happens to follow for example. The last policy statement without the bind_to, applies to all other target IP addresses other than our 192.168.10.x network.
Perfmonitor preprocessor
preprocessor perfmonitor: time 300 file /data/snort/snort.stats
As its name implies, this preprocessor measures performance. Things such as CPU usage, packet counts, and my favorite - drop rate, are measured here. The above configuration line tells the perfmonitor preprocessor to write out statistics every 300 seconds to that particular file.
sfportscan preprocessor
preprocessor sfportscan: proto { all } ignore_scanned { 192.168.1.22 }ignore_scanners { 192.168.1.150 } sense_level { low }
Not everyone feels it necessary to run this preprocessor, especially on internal network segments, where portscans should be less of an issue - but a few tuning options can go a long way. Utilizing the ignore_scanned and ignore_scanners options, can reduce portscan alerts generated by sensitive targets or sources - for instance a vulnerability assessment scanner. The sense level can be raised to higher levels to detect slow scans, but at the expense of generating more false positives - whereas setting to low will only watch for error responses from the targets of a potential scan, making this option much less noisy.
Removing unnecessary rule sets
include $RULE_PATH/smtp.rules
include $RULE_PATH/coldfusion.rules
One of the best ways to improve performance of your sensors (ie. reduction of dropped packets), is to globally remove rule sets that are not pertinent to the hosts you are protecting with this sensor. For example, do NOT include coldfusion.rules if you do not have ColdFusion servers you are protecting. Remove or comment out those rule sets that are not necessary from your snort configuration altogether.
Use of Bleeding Threats rule sets
No:
include $BLEEDING_RULE_PATH/bleeding.rules
Yes:
include $BLEEDING_RULE_PATH/bleeding-attack_response.rules
include $BLEEDING_RULE_PATH/bleeding-dos.rules
Much along the lines of globally removing rule sets that do not pertain to your environment, is if you decide to use Bleeding Threats rules, do not use the large, all inclusive bleeding.rules. Select only the individual rule sets that you are interested in using.
thresholding/suppression
suppress gen_id 1, sig_id 1231, track by_src, ip 10.10.10.10
suppress gen_id 1, sig_id 573, track by_dst, ip 192.168.1.20
I will get into this area in a future post in much more depth, but utilizing threshold.conf for both thresholding and suppression can be extremely beneficial. If you have a Nagios server that constantly trips an alert for an SNMP rule against a certain router, consider utilizing a suppression to remove this particular instance from alerting, while still allowing other hosts to trigger this rule.
Conclusion
There are numerous configuration options within Snort, and this post only touched upon the few that I feel are most immediately useful with the tweaks above. Every sensor and network is different, for example, performance tuning the stream4 preprocessor or tuning http_inspect for particular ports, will be more or less important in various situations. Utilizing a base Snort configuration, tweaking as necessary to tailor for both resource constraints (bandwidth, processor, memory) and network profile (types of servers and traffic, nature of environment, etc.), will make your Snort IDS sensor much more useful.
Friday, June 29, 2007
Saturday, June 23, 2007
How NSM Saved Christmas
'Twas the night before Christmas....well...not exactly. This is a real-world account of how I used open source tools and the foundation of Network Security Monitoring to save my chances of attending the company Christmas party. It was a few years ago in the middle of December when the incident that follows occurred, only but a couple hours before I was set to attend the party. Luckily, the practices of NSM were already in place, trimming down the time needed and stress endured considerably, while scoping the extent of the damage.
For those not familiar with the concept of NSM, I highly recommend the blog and books of Richard Bejtlich, security guru and NSM evangelist. The basic principle that NSM boils down to, is to not rely on a single point of network data for detecting and responding to your intrusions. So instead of collecting only alert data from your IDS, you supplement this alert data, with session or flow data, full content, and potentially statistical data.
In the scenario that follows, NSM was employed using various open source tools, including Sguil, Snort and SANCP. If you have never used Sguil before, you are in for a treat - as it ties together the Snort alerts, with corresponding SANCP session data and another Snort instance capturing full content data.
The First Hint
"CHAT IRC channel join", those four words is how it all began. Normally, a Snort alert of that nature would not have caused me much concern - mainly, since many co-workers and myself used IRC on a daily basis. The source IP address, however, made it all the more frightening. It happened to be a Debian FTP server we had in our DMZ, which would have absolutely no reason to be running an IRC client legitimately. Could it be an employee that was doing work on the server, deciding to install an IRC client on it and connect from there? Or, was it something more sinister, like that of a compromised Linux box joining a botnet?
The first thing that led me initially away from it being an insider doing something they should not be, was in the packet payload - viewable via Sguil from the Snort alert data collected (a sample Sguil packet view of a generic alert is shown here on the main Sguil site). A random jumble of characters for the nick used to log onto the IRC server, this is seeming stranger by the minute. Why would someone that worked here use a random character string and join a channel that did not make any more sense than the nick? From knowledge of working on the FTP server recently, I knew that there was a limited exposed attack surface, only TCP ports 21 for FTP and 22 for SSH were listening.
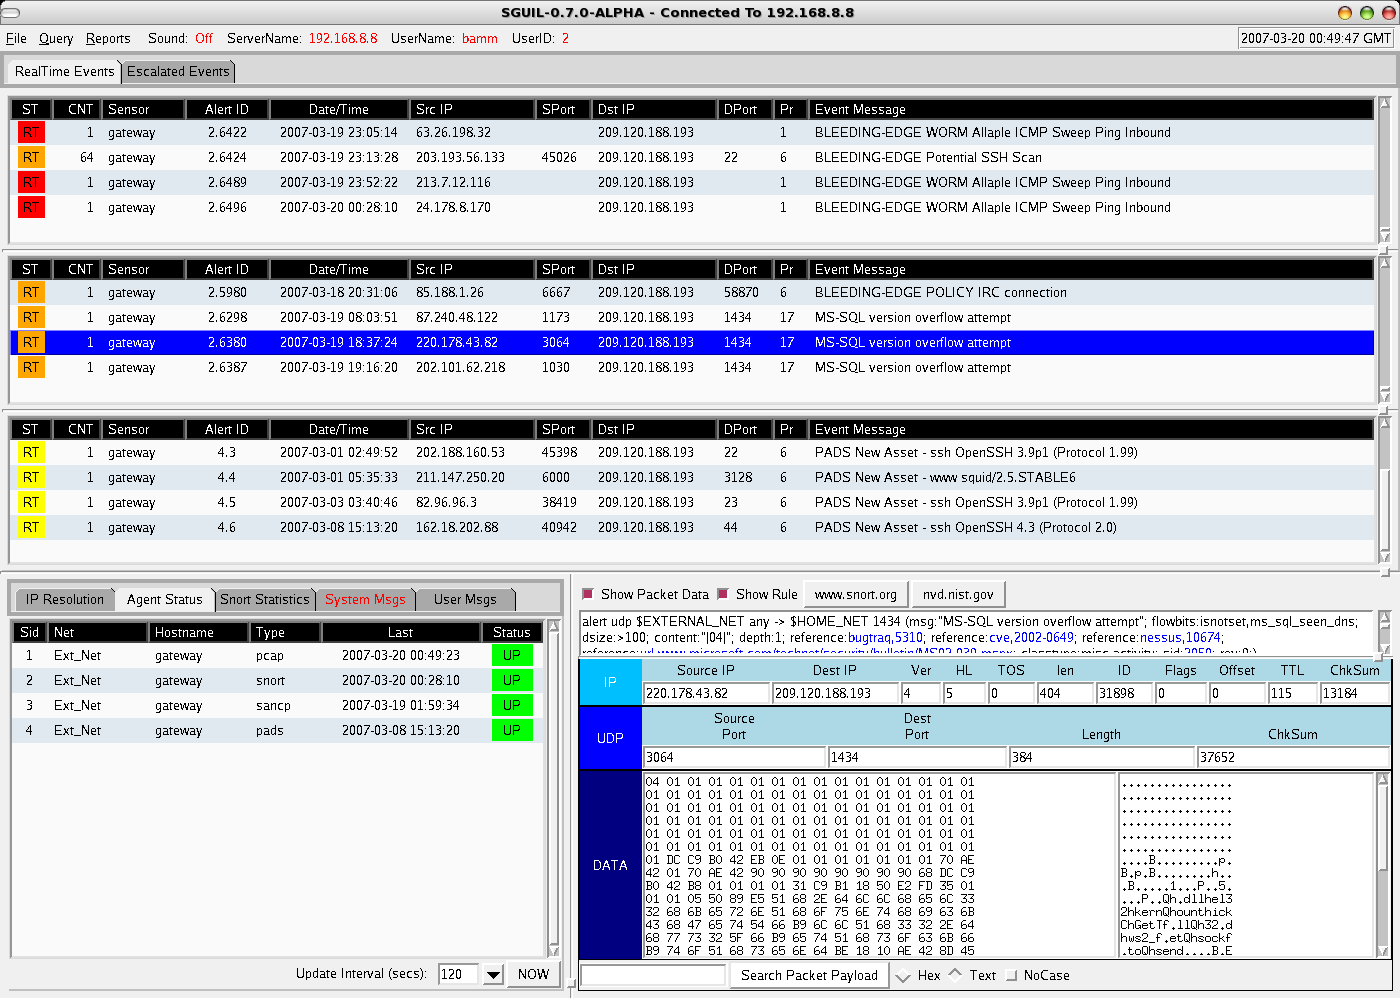
In an all too common occurrence when an IDS is deployed, our investigation without touching the server in question would most likely be over. Sure, we could have been collecting logs centrally or had some sort of host IDS installed, but using network sensors that were collecting various data, allowed us to solve this from a 3rd party point of view at the network level. Luckily for us, we had NSM already in place, so in addition to the Snort alert we saw, we were able to dig deeper into the session (ie. flow) data and full content data to further analyze what exactly was taking place.
Tracking Down the Compromise
So where did I go from here? Well...I first decided to query for any Snort alerts, on both the source and destination IP addresses for the last week - nothing of any use came back. The next step was to pull any session/flow SANCP data from Sguil's database of all connections in the last week involving our victim machine. Sguil's SANCP view, looks like this sample from the Sguil website, and includes data formatted with the following headers:
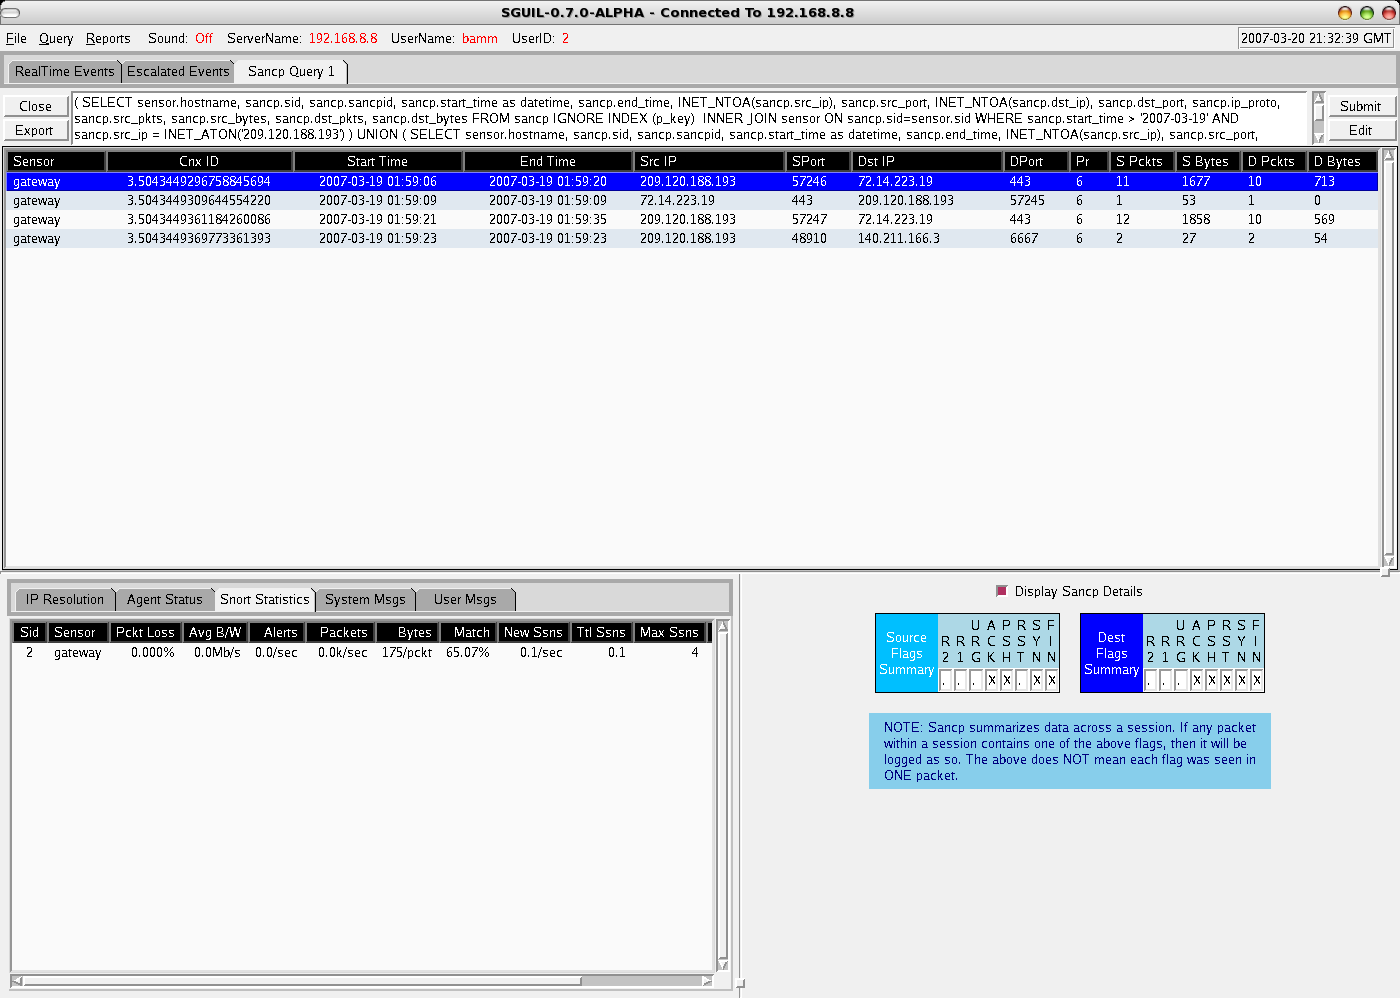
Start Time End Time SrcIP SPort DstIP DPort SBytes DBytes
From the SANCP data returned, we could see numerous connections from external addresses with very little data being exchanged to tcp port 22 of our victim machine, especially from the destination side (this is classic of SSH brute force attempts, and confirmed from central logs from the victim host). The real interesting flow results, were the sudden stop of excessive SSH connections, followed by a connection to an external FTP server and a public IRC server! Now we are getting somewhere!!
One of the best things of working with Sguil, is that we can right-click any SANCP session and request the full-content data related to it (either in full capture view via Wireshark or output in a transcript window if an ASCII-based protocol, such as HTTP, SMTP, FTP, etc) . Within a traditional Sguil setup, you have a separate instance of Snort constantly recording pcap data to hourly files, which Sguil then applies the appropriate BPFs to get the correct data requested by the analyst using the Sguil client.
With full-content data at our disposal, we immediately requested the transcripts of the IRC and FTP sessions (a sample generic transcript screenshot can be seen here from the main Sguil site). Within the FTP transcripts we notice various tarballs being downloaded (with names of not any popular software), which ironically, can be fully regenerated from the full-content data we have collected with open source tools - but that is a topic for another post. Furthermore, the IRC transcripts confirm our earlier IDS alert that suggested the victim host had in fact joined up to the popular Freenode IRC network, joining both an obscure channel and with an equally obscure nick. Forensics performed later on a copy of the hard disk showed a custom IRC client with various "enhanced" drone abilities.
So what did we learn here? As you can see, having full content data made diagnosing the issue at hand, extremely easy. But what if you don't have full content data or all the communication had been encrypted?? That is why the flow data is so important. Even eliminating the full-content analysis we did above, we were still able to find out various important things just from SANCP flow data, enough to get a sense of what had happened, including:
1. Noticing plenty of source-heavy, quick SSH connections from external addresses - implicating SSH brute force attempts to login against an account.
2. A sudden stop in the rapid SSH connections, followed by an FTP connection to an external IP address and pulling substantial amounts of data to the victim system.
3. Connection to IRC, from a machine that shouldn't be.
Scoping the Extent of the Incident
The final step before taking this machine out of service, to both be forensically analyzed and rebuilt from known good sources, was to scope the extent of the damage.
Once again, we turned to the flow data in Sguil provided by SANCP. The following steps gave that "warm, fuzzy feeling" that we were okay:
1. Lookups across the SANCP database table that involved any communication from all external IP addresses involved. This included, the original SSH brute force scanner, which also happened to be the box they logged into SSH with once successfully cracking a password. Also the FTP server the tools were grabbed from and IRC server they connected to. Nothing beyond the time frame and machines we had already been investigating gave cause for alarm.
2. The victim machine, our Debian FTP server in the DMZ, had its IP address searched across all of the SANCP data available as well - with importance placed on connections both 72 hours prior to the successful compromise and anything thereafter. With importance this time placed on looking for such things as attacks on other DMZ hosts of ours in the same accessible subnet, to scanning of external hosts on strange ports.
3. Finally, a search across the SANCP table for other hosts in the same DMZ subnet. Looking for any protocols used or communications that appeared out of the norm.
Having centralized logs, HIDS, rootkit checkers, etc. are an ideal situation to compliment network based evidence, but if given the choice, a properly deployed NSM sensor is my first course of action when responding to intrusions. Just utilizing our NSM tools, we determined what happened to the machine, what it did, and scoped the extent of the intrusion.
After finishing our network-based analysis, we had a look at our central log server. The syslog data confirmed, shortly after the brute force attacks, and at the same time as the network data showed the last bits of SSH communication - a successful login on an unprivileged account. The files downloaded via FTP to /tmp, which included the custom IRC bot client, all with permissions and ownership of this compromised, unprivileged account. A successful grinding of a weak user account password over SSH had been the way in, with the common post-attack scenario of it being joined to a botnet army of drones, the result.
Conclusion
Hopefully this article has sparked an interest in enabling your IDS sensors to do more, and provide you with a broad way of investigating incidents. Once you move away from the alert-only mentality of a traditional IDS, you will find even more value in the data that tools like Sguil provide. For more information on NSM and the various tools that can be used, I point you again to Richard Bejtlich's books and the Sguil/NSM wiki.
* All of the network forensics (ie. non-local), were completed in only a couple of hours, leaving plenty of time to have fun at the Christmas party!
Friday, June 15, 2007
Incident Response: Breaking the Cycle
An alert comes into your email inbox, notifying of a possible intrusion noticed by one of your sensors. What do you do next? Unfortunately, a common answer to this question, is the analyst rushes to logon to the machine that is potentially breached - which is exactly the WRONG thing to do!
I guess it is human nature to readily go to an ailing object, in our case the victim system. But, when doing so in responding to possible intrusions, you potentially contaminate evidence, or possibly alert the intruder that you know of their existence - losing the upper hand you currently possess in organizing your plan. Even if you do go to that victim machine and start running commands such as 'w' or 'ps -ef', how can you trust their output - trojaning system utilities is a common reinforcement procedure after a successful compromise.
As I have discussed in a previous post, having a robust security monitoring infrastructure is imperative to your noticing and responding to incidents. With centrally located data, you can form a much clearer picture as to what could have happened, or set your mind at ease that nothing has happened - all without touching the victim machine.
So what are some ways to use our security monitoring infrastructure for IR:
Flow data: If you collect flow data, from say Argus, SANCP, or even Cisco Netflow - you could have all the connections that both the source machine and victim machine have made. Querying for what other hosts, ports, and how much data has been transferred are all helpful clues. You may notice strange connections to IRC servers, or large amounts of data transferred over FTP. Flow data can prove invaluable when you don't have access to collected full content data, due to technical or political limitations.
Network IDS Alerts: They aren't just for real-time alerting! Why not search your recorded IDS alerts for previous hits on your victim's IP address or maybe the attacking source's network address. Any otherwise insignificant alert like a portscan, may provide better context to the investigation at hand.
Logs: Both system and application logs can play a huge part here. The key point that needs to be made, is these logs must be collected centrally. They are too easily removed from the "hacked" machine if so desired by an attacker. Logs can show you who logged in recently or what account may have been compromised for instance.
HIDS: If you run a HIDS, you may have file modification alerts - noticing an addition to /etc/passwd or a change to your DNS resolver. These alerts and your system logs may be your only concrete evidence if an encrypted channel such as SSL or SSH is being used.
Having some sort of SIM/SEIM or Event Management system, allows you to review these alerts from one interface, cross-reference, or correlate. Sometimes, logging onto the victim machine will unfortunately be your only option - for instance, if an important clue is only available in running memory on the system. When you get to this stage, remember to always use trusted read-only media with the tools you require. The most important point to take away from this post, is to exhaust your options BEFORE touching the victim machine.
Sunday, June 10, 2007
Prelude-LML as a UDP Listener

If you have ever used Prelude's Log Monitoring Lackey (LML) before, you probably know that the default behavior is to process these log files that happen to be local to the server. What I will show in this post, is how to set Prelude-LML to listen on a UDP port, and accept messages there from Syslog-NG or anything that can transport the messages to it via UDP.
Having Prelude-LML listen for UDP messages, is as easy as adding the following to your startup options:
--format syslog --udp-server=192.168.1.25:10514
Basically, what the above says, is for the Syslog format, listen on the interface with IP address 192.168.1.25 for UDP messages on port 10514. Listening on UDP, can also be specified in the format section in prelude-lml.conf of your choosing, whether a format for Syslog messages or maybe Apache log formats, etc.
So now you have a Prelude-LML instance listening for UDP port 10514 messages on its appropriate network interface. Let us also assume you already collect your Syslog data from all your hosts in your environment centrally via TCP, to a server running Syslog-NG. All you need to add to your Syslog-NG configuration would be something similar to the following:
destination d_prelude_lml{ udp("192.168.1.25" port(10514)); };
log { source(s_tcp); destination(d_prelude_lml); };
The above assumes, you already collect your logs centrally from all hosts via TCP, and have labeled the source as s_tcp in your Syslog-NG configuration - adjust accordingly. We created a new destination call d_prelude_lml, pointing it to use udp with our IP and port combination we setup on our Prelude-LML server. The log statement we have added, combines the source TCP statement, with our new Prelude-LML destination statement to send any logs coming into our Syslog-NG central log server from hosts over TCP out over UDP to our LML instance. Allowing all the logs to be processed via Prelude-LML, but without, for instance, being stored on our LML server.
Prelude-LML is highly configurable, many more options and combinations can be made to tailor it for your environment. I hope this provided one option of adapting it to an architecture that already collects their Syslog data centrally.
Thursday, June 7, 2007
Prelude for Event Management (ie. SIM)

The hybrid IDS, or "meta-IDS", as described by the project's founder, makes an excellent choice as a SIM/Event Management tool in what is a sparse area of the Open Source world. Not only is it "good enough" to justify not throwing hundreds of thousands of dollars at an Arcsight or Network Intelligence solution, it has far exceeded my expectations in many areas.
I'd like to commence this first post on Prelude, by detailing five things that I most like about it. In no particular order, let us begin the Prelude Five.
** The Framework **
When Prelude first started out, it was very much an IDS, with a NIDS of its own, etc. But realizing that the framework itself was the crux of this project, was probably the wisest design decision made.
From deploying and configuring numerous sensors, from Samhain to Snort, the Prelude library makes it seamless to connect agents/sensors into the existing framework. TLS encrypted channels secure the data in transit, from your agents to Prelude Managers at a central site or in a relaying configuration to distribute the load. Registration of the individual agents/sensors/relays, allows you to only accept and connect systems that you specifically specify.
The distributed architecture allows for various systems, along the route to your central site, to spool events and data when various relays, etc. are unavailable. Both allowing you to spread out your load, and have fault-tolerance baked in.
** Versatile API **
Have a sensor or tool that has data you want sent to Prelude and it isn't one of the natively supported sensors? No big deal! Prelude's API allows you to use C, Perl, or Python to format your alert/event in IDMEF and pump it into the Prelude framework. Install the Prelude library, format the data appropriately, and use one of the languages to create your client and away you go.
**Prewikka**
If there is one thing that the Open Source world of projects frequently lacks, it is a nice GUI interface. Prewikka, the web interface to Prelude, is one exception to this statement.
The ability to view alerts, drill-down to event data, view agents - and not to mention the additional features in a commercial add-on (that includes graphs, stats, ticketing, reports, etc.). The Python-based code, runs either as a CGI program, mod_python module or within its own self-contained web daemon. All in all, a very well thought out interface that is both usable and constantly improving.
**Analysis Engines**
Two analyzers that come with Prelude, are the Correlator and LML (log monitoring lackey).
Let's say you want to analyze your syslog data or even your windows event logs (exporting them via ntsyslog in a syslog format), this is what LML is for. Heavily weighted in regular expressions, you generate alerts from your logs on failed SSH logins, firewall events, mail system abnormalities, and all the usual suspects that make up a standard log analyzer. But here's the real catch....most of these open source log analyzers are written in Perl, while LML is "highly optimized" in C! I've personally seen LML with the default ruleset not break a sweat on thousands of large syslog messages per second, when SEC (a very fine pattern matching program itself) get brought to its knees with a much smaller, tuned ruleset.
Then there is the Correlator, still technically not released officially, and with a very minimal ruleset at the moment, but nonetheless extremely usable. What would an event management solution be if it couldn't take in Snort alerts, and correlate them with firewall or syslog events. This is just what the Correlator does, by leveraging Prelude's heavy reliance on the IDMEF RFC for event format, allowing correlation across any of the fields.
Best of all, both with Correlator and LML, you can add/change/delete rules as you see fit. No black box, enable or disable only options for you - this is Open Source my friend!
**Modular Plugins**
So you want to pump your data into a database, who wouldn't....so enable the database plugin, make a few changes, and presto. Maybe you don't want to log to the database and you want all your alerts in a flat text file, sure that can be done. Or you could purchase, for minimal dollars, the SMTP alerting plugin to send alerts to you via email.
All the plugins are enabled/disabled in the Prelude Manager, and allow various things to happen with this data you are gathering in from your various sensors. Remove what you don't need, and add what you do - you have full control of this.
If modular plugins aren't enough, you can stack them too. Stacking the plugins allows you to take the benefits of one plugin, say the filtering capabilities of the IDMEF-Criteria plugin, and hook it to the Thresholding plugin (limiting the number of events processed), then hooking that to the Database plugin. Effectively, creating a stack of plugins hooking into the next to manipulate a chain of events as you see fit, on the exact events or data that you require.
As you can see, Prelude has plenty to offer in the Event Management/SIM space, is actively developed and supported, with both an Open Source community and a commercial outfit providing both support and enhancements.
Friday, June 1, 2007
Argus: The Basics
When regular network IDS alerts aren't enough, and turning to full content data is not an option - the use of flow data can prove useful in tracking down the connections, bandwidth usage, and intents of particular hosts. Argus fits the bill as a lightweight, yet fully featured, bi-directional flow suite of tools.
Capturing data can be as simple as this:
argus -d -i eth0 -w logfile
Where -d starts argus as a daemon, -i specifies the network interface to capture on, and -w tells it where to write out its data to. Scripting the restart, naming of the output files, etc. allow for a more robust collecting scheme and more manageable file sizes.
Now let's say you want to look for a certain host communicating. You could do something as simple as this:
ra -r logfile -nn - host 10.10.5.4
This uses the argus client (ra), to read the logfile with -r. The -nn tells argus to not resolve IP addresses to hostnames, and to also not translate port numbers to service names - making the processing of the file that much faster. The pieces that follow the last (-), can be any BPF filter, with any number of combinations. The BPF used above, simply says, only include records that have IP address 10.10.5.4 as the source or destination. Various other ra* clients exist, for various different uses - as we will get into below.
Output from the above example could look like this:
01 Jun 07 14:01:22 q tcp 192.168.1.25 -> 10.10.5.4 7 1236 FIN
01 Jun 07 14:01:31 q udp 10.10.5.4 <-> 192.168.10.10 13 1411 CON
The ra client displays various useful information, such as a timestamp, protocol, source & destination ports and IPs, source and destination bytes transferred, and last known established state or pseudo-state.
Let's move on to a more complicated example, combining various argus clients to pull together some data that we may be interested in. Combining argus clients, to process the outputs of each sequentially allows much more powerful results.
Since argus takes a best guess as to an established flow or session, ragator, aggregates the various flows into what it thinks a "conversation" may contain - by combining flows it believes go together. Let's run it as so:
ragator -r logfile -nn -w tempgator - host 10.10.5.4
We read in our logfile with ragator, this time writing out our results to a new file called tempgator. Ragator aggregates the flows into "conversations" containing our host 10.10.5.4 in either the source or destination IP. This data could be useful to get a bigger picture, maybe seeing large transfers, etc. But let's now process this file through ramon to find our top pair of talkers with 10.10.5.4 being one on either side.
ramon -r tempgator -nn -w tempmon -M Matrix
In the above, ramon processes the ragator file, and finding the top pairs of talkers by bytes. Various other options can be passed to the -M option, such as finding only the top 10 talkers, etc. We will then process this resultant file through rasort to list our top talker pairs in a more orderly format.
rasort -r tempmon -nn -M saddr bytes
What we did here was tell rasort to list, in order, first by the source IP address, then by total bytes transferred the top talkers' conversations. Quickly identifying who were the largest bandwidth hoggers from our resultant argus capture file. Numerous sorting options are available to rasort via the -M option.
One other useful client to mention is racount. Racount will take a statistical snapshot of the file that you process to give you some higher level protocol breakdowns. As an example, run:
racount -ar logfile
This will give statistical counts of IP, TCP, UDP, etc. breakdowns of packets, bytes, etc. Useful for determining what the general makeup of this argus captured file is.
Argus includes many options, as this was only a small sampling of options available. Furthermore, v3.0 will introduce racluster which greatly simplifies the various steps needed to take to get data in the format that other argus clients act upon.
Subscribe to:
Posts (Atom)
-
Some quick notes on testing out Pig in local mode to process some basic Argus data. Argus Capture a sampling of network traffic with Argus a...
-
 As a big believer in flow/session data collection in all NIDS locations, it is only right that there be an easy way to do so at home without...
 -
 I figured I would post some general tuning options that really improve performance on busy central syslog-ng servers. The following setting...